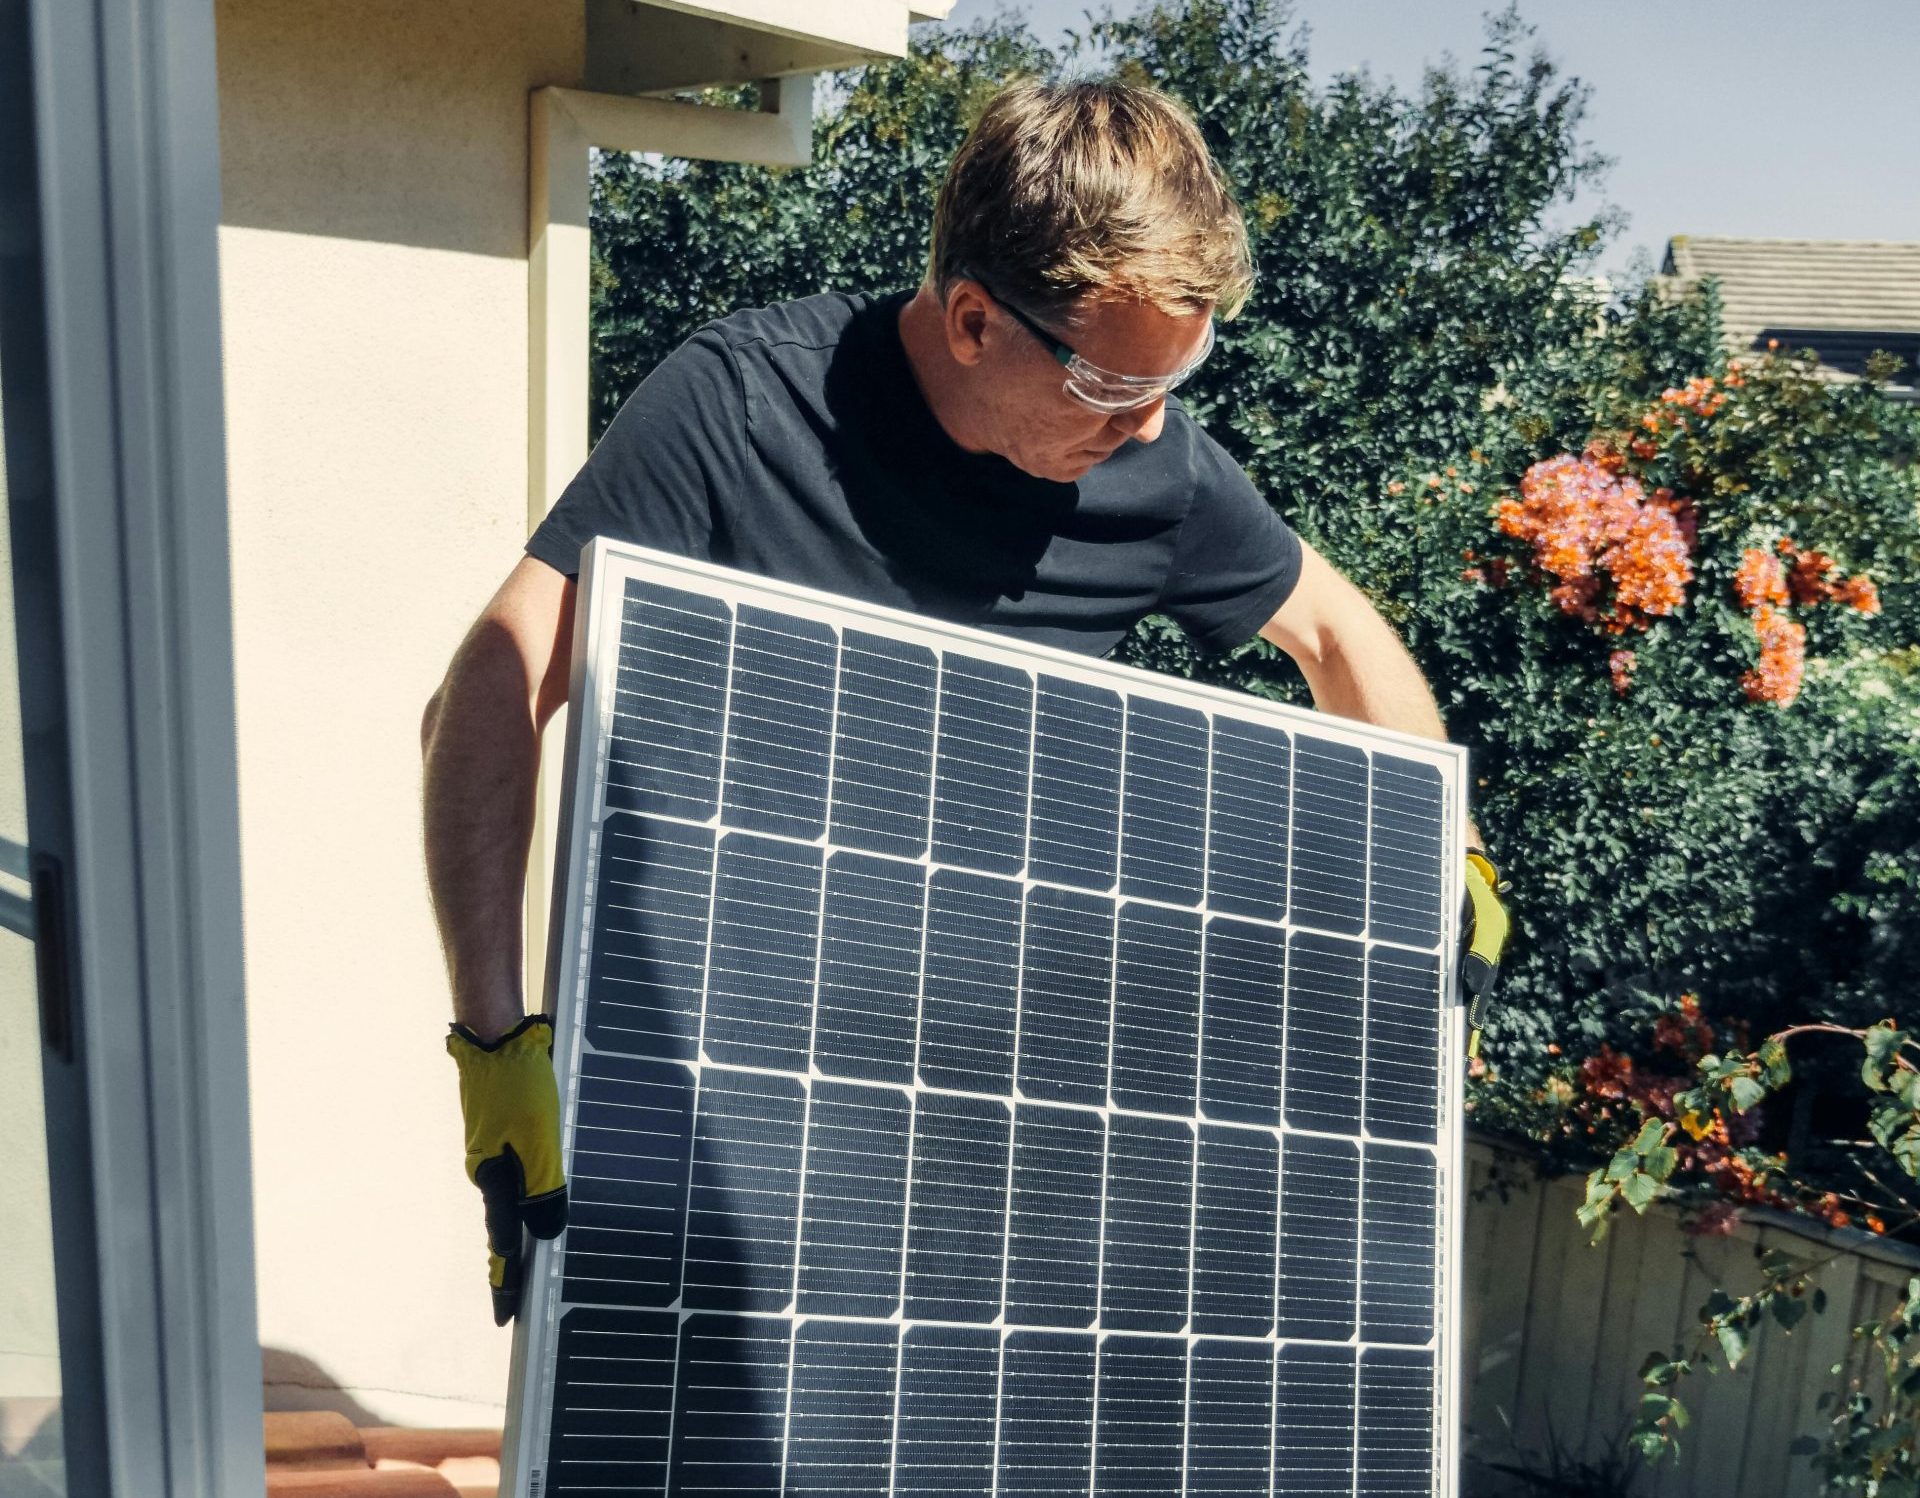
In a new study, Wolf River Electric has ranked all 50 U.S. states by how quickly homeowners can repay solar installation fees as a result of their yearly savings from solar. The Solar Payback Index combines state electricity prices, average installation costs, and household energy usage to calculate real break-even timelines. The findings challenge some widely held assumptions about where solar makes most financial sense.
The national average break-even stands at 13.5 years after applying the 30% federal Residential Clean Energy Credit to the initial cost. However, there are still large differences on the state level. California homeowners can break even in 7.3 years, while Minnesota homeowners face a wait of 20.5 years.
Justin Nielsen, Founder and General Manager at Wolf River Electric, says: “It’s only natural for homeowners to presume that the sunniest states automatically offer the best solar return. You’d think that more sun equated to more power and more savings from solar, but our data shows electricity prices often have an even bigger impact. In states where grid power is expensive, solar can pay for itself years sooner, regardless of how much sun you get.”
Top 10 states: fastest solar payback
These states offer homeowners the quickest return on investment, ranked by years to break even:
| Rank | State | Break-Even | Annual Savings | Electricity Price (cents/kWh) |
| 1 | California | 7.3 years | $2,037/yr | $0.3375 |
| 2 | Hawaii | 8.2 years | $2,369/yr | $0.3989 |
| 3 | Connecticut | 9.3 years | $2,322/yr | $0.2784 |
| 4 | Mississippi | 9.7 years | $2,016/yr | $0.1453 |
| 5 | Arizona | 9.8 years | $2,015/yr | $0.1562 |
| 6 | Texas | 10.2 years | $2,128/yr | $0.1618 |
| 7 | Maryland | 10.4 years | $2,497/yr | $0.2240 |
| 8 | Rhode Island | 10.5 years | $2,130/yr | $0.3130 |
| 9 | New Hampshire | 11.0 years | $2,035/yr | $0.2739 |
| 10 | Florida | 11.1 years | $2,089/yr | $0.1577 |
California tops the index not because it is the sunniest state, Arizona receives more annual sunshine hours, but because its electricity rates are among the highest in the country at 33.75 cents per kilowatt-hour. Homeowners there can save an average of $2,037 per year and break even in 7.3 years.
Mississippi rates fourth. Despite relatively affordable electricity at 14.53 cents per kilowatt-hour, the state’s high average energy consumption pushes annual savings high enough to deliver a break-even of just 9.7 years, defying the assumption that cheap power always means poor solar ROI.
Regional breakdown
Breaking the data down by region shows a clear pattern, coastal and southern states consistently outperform the Midwest.
| Region | Average Break-Even | Best State | Average Annual Savings |
| Northeast | 11.9 years | Connecticut (9.3 yrs) | $1,998/yr avg |
| Southwest | 12.1 years | Arizona (9.8 yrs) | $1,799/yr avg |
| Southeast | 12.7 years | Mississippi (9.7 yrs) | $1,976/yr avg |
| West | 13.9 years | California (7.3 yrs) | $1,653/yr avg |
| Midwest | 15.8 years | South Dakota (12.6 yrs) | $1,578/yr avg |
The Northeast leads regionally with an average break-even of 11.9 years, driven by high electricity costs in states like Connecticut and Rhode Island. The Midwest is the clear outlier at 15.8 years, more than four years longer than the Northeast, with states like Minnesota, Iowa, and Wisconsin hampered by low electricity prices that limit the financial case for solar.
The sunshine myth: why your power bill matters more than your sun hours
One of the most counterintuitive findings is that sunshine alone does not determine solar ROI. Arizona receives approximately 3,800 sun hours annually, among the highest in the country, yet ranks fifth nationally, behind Connecticut, which sees far fewer sun hours but has electricity prices nearly double those of Arizona.
The data confirms a consistent rule. Where electricity is expensive, solar wins faster. Where power is cheap, the financial case weakens regardless of sun exposure.